Monitoring file servers with Checkmk
 on May 30, 2022
File server monitoring is important because many of your colleagues depend on efficient ways to access and share data. If IT teams are not able to identify and fix problems promptly, they will quickly experience a large volume of support requests and complaints. Monitoring helps IT teams improve the reliability and trustworthiness of file servers, as well as ensure good performance.
This tutorial explains how to use Checkmk to set up comprehensive monitoring of your file servers in just a few minutes. It does not matter which operating system and which file server protocol you use. Checkmk provides suitable agents for Windows servers, Unix systems, and all common Linux distributions. Additionally, there are plug-ins for various file server protocols and a variety of mechanisms for monitoring files and folders. Checkmk also includes forecasting, which you can use to predict your capacity usage, for example.
A monitoring has to deliver quite a lot of things, but you will see that it is fairly easy to get the job done if you use Checkmk. If you follow this step-by-step guide, you will have a file server monitoring set up in just a few minutes. If you are looking for more general information, I recommend this guide on server monitoring.
In my example, I will use a Linux server that shares data via two file server protocols: Network File System (NFS) and Server Message Blocks (SMB). You can also monitor other types of file servers based on this tutorial. Checkmk has agents, active checks, and suitable plug-ins for all common server types. The procedure differs minimally, and you only need to customize the agent and plug-ins appropriate for your environment.
For example, if you rely on a Windows server and the File Transfer Protocol (FTP), you can also follow this tutorial. The prerequisite for monitoring is that you have a running Checkmk site that connects to your file server. You can use the current version of Checkmk Trial for this purpose. In my case, I set up a Checkmk Trial version 2.1. on a separate Linux server in the same network. For stability reasons you should not install Checkmk and your file server on the same server, instead, you should install Checkmk on a separate server.
Step 1: Monitor the file server with the Checkmk agent
The basis for the monitoring is the installation of the Checkmk agent on the host and the inclusion of the file server in the monitoring.
- Switch to the Checkmk user interface. Go to Setup -> Agents -> Windows, Linux, Solaris, AIX and download the agent for your operating system. For my example, I download the DEB package.
- Install the agent on your file server.
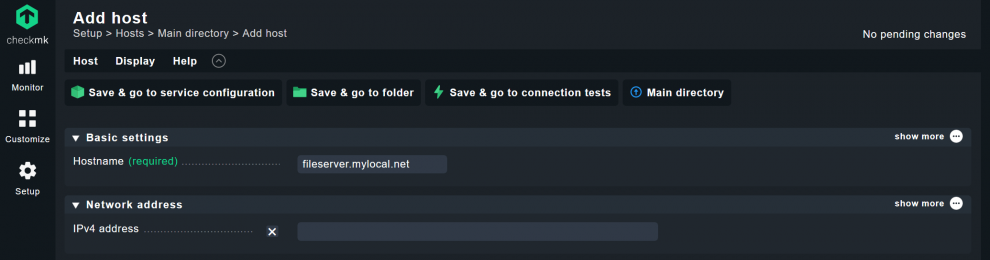
- Back in Checkmk, under Setup -> Hosts, click on Add host.
- Enter the name of your file server as Hostname. If the name is not resolvable via DNS, you still have to enter the IP address of your file server under IPv4 address. In my case, the server is called ‘fileserver.mylocal.net’, so I don't need to enter an IP address.
- Click on Save & go to service configuration and run a Full service scan.
Here there is a surprise in my example. In addition to the standard services such as CPU utilization and memory, the Checkmk agent has also detected my RAID. This consists of two mirrored hard disks, and Checkmk has suggested that I include these as services directly in the monitoring. The three services labeled ‘MD Softraid’ show the state of my two hard drives as well as the overall state of the RAID.

This is possible because I have previously set up a software RAID under Linux. That RAID is automatically recognized by the Checkmk Linux agent. In the same way, Checkmk sees a host’s mounted hard disks. Of course. Checkmk also supports other RAID systems, but for this, you usually have to install a suitable Checkmk plug-in. Before I show you this in the next step, however, you need to finish adding the host.
- Click Accept all to include any services detected in the monitoring.
- Next, click on the yellow icon with the exclamation mark in the upper right corner. You should then see the ‘pending changes’.
- Click Activate on selected sites.
Step 2: Using Checkmk's Magic Factor for all file systems
You have now included your file server in the monitoring, but you should configure it further to ensure even better performance and trustworthiness. One thing I generally recommend for all file systems is to adjust the thresholds for storage space by using the Magic Factor:
- Search for ‘filesystems’ under Setup.
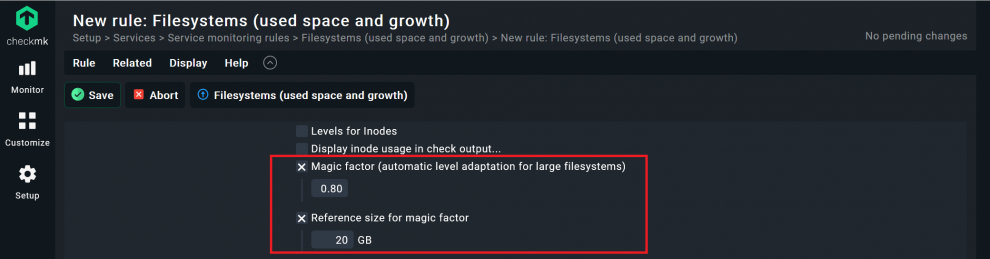
- Click on ‘Filesystems (used space and growth)’. Select Add rule.
- Clicking the checkbox at Magic factor (automatic level adaptation for large filesystems), leave the default value at ‘0.80’.
- Activate the checkbox for Reference size for magic factor and here as well keep the default value of ‘20 GB’.
- If you really want to apply this rule to all systems, you can leave all of the options under Conditions as they are.
- Click on Save.
By default, a filesystem's service state in Checkmk changes from OK to WARN when memory utilization is between 80% and 90%. Above 90%, the state becomes CRIT. The Magic Factor now ensures that smaller file systems with less than 20 gigabytes get lower thresholds. Larger systems, on the other hand, get higher thresholds. For example, when using the default values with a Magic Factor of 0.80 and a reference size of 20 gigabytes, the services of a file system with five gigabytes already change to WARN at 74% memory utilization, whereas a file system with 800 gigabytes will only change to WARN at 90%. With this feature, you can ensure that Checkmk factors the size of the file system into its calculations.
In the ‘Filesystems (used space and growth)’ rule, you can also see that there are many other ways to adjust the thresholds. You do not need that in this tutorial.
Step 3: Customizing and baking agents with the Agent Bakery
The easiest way to customize an agent is to use the Agent Bakery, which is included as a function in the Checkmk Enterprise Edition. If you are using the Checkmk Raw Edition, you will need to configure the agent manually.
In my example, I show you how to install the 'NFS exports' agent plug-in to monitor the NFS mounts on your file server. I also install the ‘SMART hard disk plug-in’ to keep an eye on the hardware for my hard disks. I also use Checkmk's Fileinfo check so that I can monitor individual files on my file server.
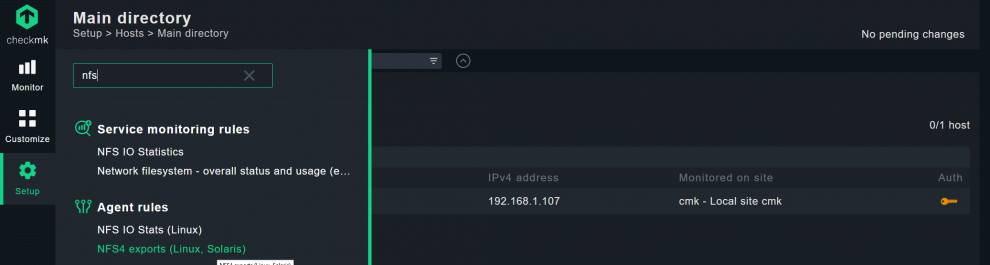
- Click Setup and search for ‘nfs’.
- Select the NFS4 exports (Linux, Solaris) rule.
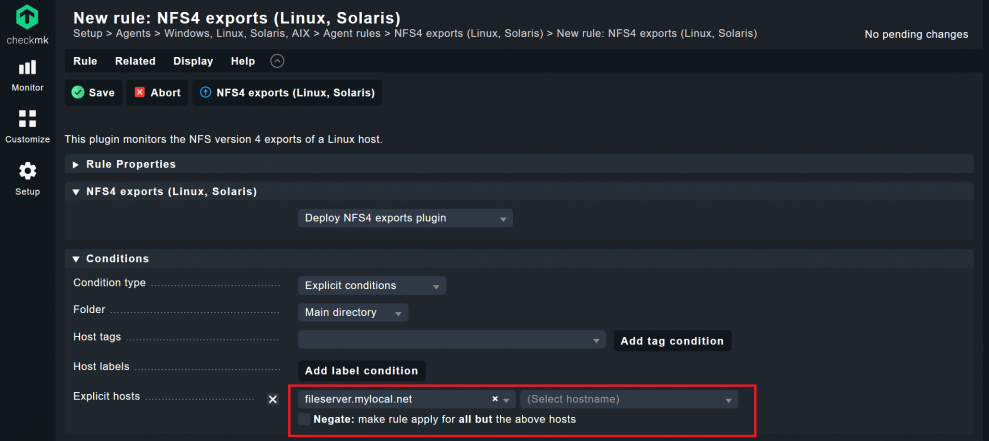
- Click on Add rule.
- In the next window, you don't have to change much, just decide under Conditions for which hosts Checkmk should apply the rule. In my case, I only specified my file server by checking the box at ‘Explicit hosts’ and specifying the name of the host.
- Click on Save.
Alternatively, you can bind rules to tags, labels, or folder structures. By doing this, you only need to create the rules once and can then apply them automatically to all selected hosts. This is a great help if you use multiple file servers with the same configuration. The 7th episode in the Checkmk Video-Tutorial series shows how to use such mechanisms practically.
With this, you have configured the first plug-in. Now I can use the SMART plug-in to monitor hardware hard drives. The prerequisite for this is that your Linux distribution supports the ‘Smartmontools’ package. This should be pre-installed on almost all common Linux distributions.
- Under Setup, search for ‘smart’ and click on SMART harddisk monitoring (Linux).
- Click on Add rule.
- Under Conditions, again activate the checkbox at ‘Explicit hosts’ and enter the file server’s name.
- Click on Save.
And you just have prepared another plug-in for the agent on your file server. Next, I'll show you how to use the Fileinfo check. It allows you to monitor the availability, age or size of the files on a server. This is useful if, for example, you want to monitor the timely deletion of information or the availability of individual files. In my example, I want to monitor a single file.
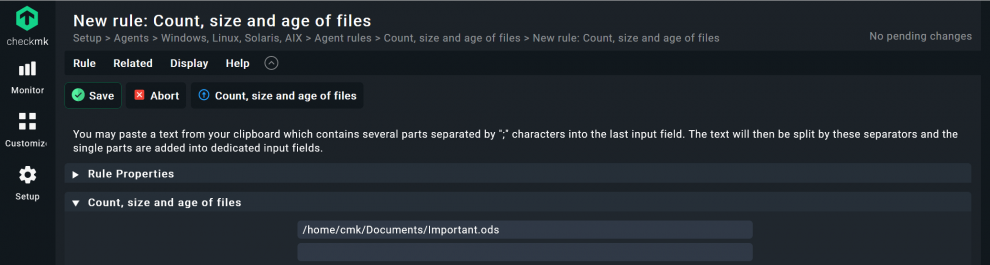
- Under Setup, search for ‘fileinfo’ and select Count, size and age of files, and click Add rule again.
- Now you need to specify the file path for the file under Count, size and age of files. You can of course monitor multiple files on the file server. I decided to monitor the file ‘Important.ods’ for the user ‘cmk’. Therefore I specify ‘/home/cmk/Documents/Important.ods’ as file path.
- Under Conditions, activate the ‘Explicit hosts’ checkbox and enter the name of the file server.
- Then Save.
Once you have configured the Fileinfo check, Checkmk will now identify the selected file as a service in the monitoring. In my case, I only check that the file is present and don't need to do any other customization.
If, for example, you still want to check the age or size of the file, you must edit the rule for this service accordingly once it has been included in the monitoring. To do this, search again for ‘fileinfo’ under Setup and then select ‘Size and age of single files’ under Service monitoring rules. You can specify threshold values according to your requirements under Value. However, make sure that you edit the rule you have already created and do not create a new rule.
For this reason, I will first complete the configuration of the agent. You can add additional plug-ins to the agent following exactly this same procedure. If your file server is not a virtual machine, then it probably contains disks in a hardware RAID. For example, if you are using a hardware RAID such as LSI or MegaRAID, you can search for the appropriate plug-in under Setup and add it to the agent using the same procedure. Checkmk also provides matching plug-ins for, for example, Veeam, Arcserveo, and Unitrends. This allows you to monitor the successful creation of backups with a backup solution.
- After you have edited the agent to your requirements, again activate a ‘pending changes’.
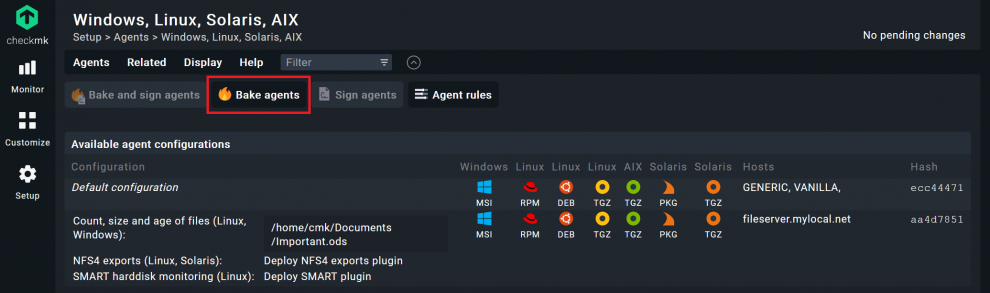
- Go to Setup -> Agents -> Windows, Linux, Solaris, AIX and click on ‘Bake agents’. After baking, a new agent should now appear.
- Install the new agent on your file server exactly as before. This will overwrite the old agent’s configuration.
In my case, the Linux agent already provides a lot of hardware data. Especially for hardware monitoring, it is often useful to use other data sources besides the Checkmk agent, for example, Checkmk can retrieve data from management boards or IPMI.
Step 4: Monitoring SMB Shares with an active check
The Checkmk agent monitors the configuration on the file server, but cannot check whether users can actually access the data on the file server. It, therefore, makes sense that you also check for external access. That's why active checks are important. Here the monitoring server itself is accessing the file server shares. This means that Checkmk directly establishes a connection to the monitored system and thus retrieves the monitoring data, without using an agent.
I will now show you how to monitor SMB shares with an active check. Checkmk also has similar checks for FTP, HTTP, and many other protocols.
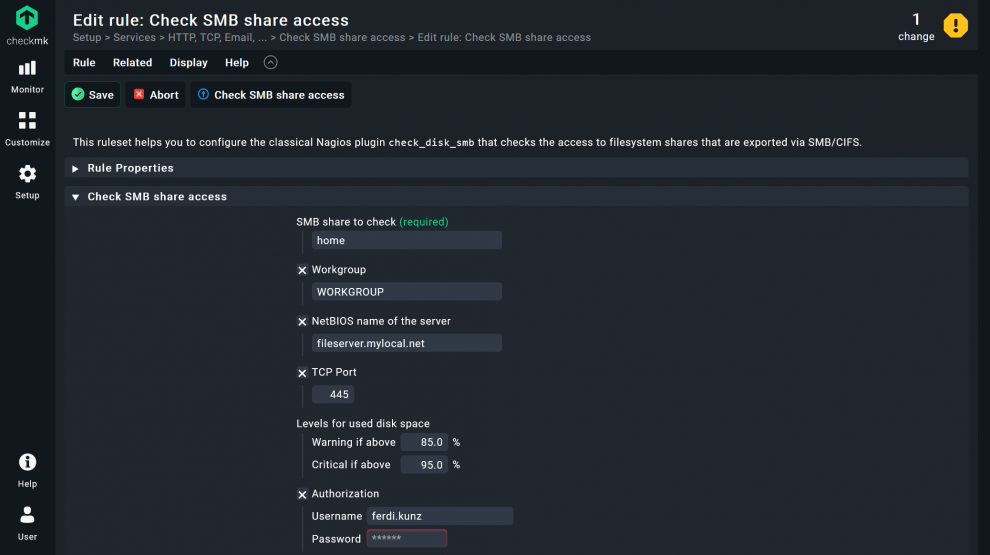
- Under Setup, search for ‘smb’ and select ‘Check SMB share access’.
- Click again on Add rule.
- Under Check SMB share access, you have to edit some items. At SMB share to check, enter the share(s) you want to monitor. The name must match the SMB configuration on the file server. In my case, I have only one share with the name ‘home’.
- At Workgroup, you enter the name of the workgroup. In my case ‘WORKGROUP’. If you use Active Directory, you need this information in any case, otherwise, this is not strictly necessary, but recommended.
- Since I use NetBIOS in my network, I enter the file server’s name under NetBIOS name of the server. Ideally, the hostname in Checkmk and the NetBIOS name are identical. This is the case in my example, so I enter ‘fileserver.mylocal.net’.
- Since I use the TCP port, I enable the checkbox but keep the default value. If you use a different port, you will need to edit the configuration accordingly.
- I leave the thresholds for Levels for used disk space as they are. You can of course customize these as needed.
- Under Authorization, you must enter the access credentials of a user with access to the file server. For security reasons, this user should only have read access to the shares that you have previously listed.
- Next, scroll down to the Conditions. Click again on the checkbox at ‘Explicit hosts’ and enter your file server. With this you add this monitoring service to your file server host in Checkmk.
- Click Save.
Since I have attached this service to my file server, I will be monitoring the free space twice in this example, but from different directions. On the one hand, the Checkmk agent transmits this monitoring data, on the other hand, the active SMB check also queries the memory usage. This is not a bad thing, but you should keep the paths of information coming into your monitoring in mind.
Step 5: Monitoring backups with Checkmk
In any case, you should create backups of the data on your file server. That is why monitoring the backup process is an essential part of file server monitoring. As mentioned above, Checkmk has plug-ins for popular backup solutions. In addition, you can use the ‘Logwatch’ agent plug-in to monitor specific events, such as the successful execution of a backup.
Monitoring backups, however, is beyond the scope of this tutorial. Nevertheless, I would like to show you how to monitor the execution of backup cronjobs. This is really easy because the required script mk-job is already a part of the Checkmk Linux Agent.
Using the Linux console, all you will need to do is to add mk-job and a service name as a prefix to the respective cronjob. In my example, this is a backup that runs ten minutes after midnight every day. The associated file is located on my file server under the file path etc/cron.d/backup and looks like this: :
crontab
10 0 * * * root /usr/local/bin/backup >/dev/null
I now add the prefix and my service name:
crontab
# Syntax: <minute> <hour> <day> <month> <day of month> <user> mk-job <service name> <command>
If you now run the customized cronjob, mk-job saves the readings under ‘/var/lib/check_mk_agent/job/root’. Since this job belongs to the root user, mk-job can recreate this directory if it does not already exist.
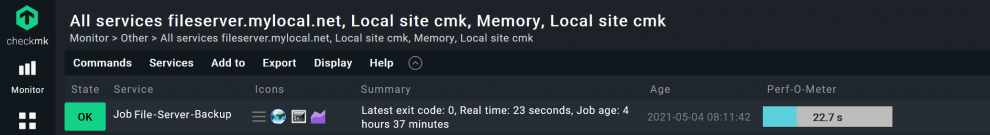
Your server must run your monitored cronjob with the changed prefix at least once to write the data. The agent can then check whether there is data in the ‘/var/lib/check_mk_agent/job/’ directory and append it to the agent's output. The status of the cronjob is thus a part of the monitoring and shows up as a service in Checkmk. This is why it is important to use an individual service name. In my example my cronjob looks like this later in the monitoring:
Step 6: Adding new monitoring services to the monitoring
Once you have set up the necessary plug-ins and active checks for your server, you need to include all of the services in the monitoring.
- Under Setup -> Hosts click on your file server, then on Save & go to service configuration to run a Full Service scan. In my case, Checkmk now recognizes an NFS mount, my SMB share, my cronjob, and my disks as new services.
If more NFS mounts are added in the future the NFS exports plug-in will detect them automatically. New SMB shares, on the other hand, must again be set up manually in Checkmk.
- Click Accept all to add the new services to the monitoring.
- Again, accept the ‘pending changes’ by clicking Activate on selected sites.
- If you click on your file server under Monitor -> All hosts, you will see all services in your file server.

Although the monitoring data for these services comes from different sources, Checkmk maps them all to one host, my file server. As well as the Checkmk agent and active checks, you can include other, arbitrary data sources. For example, if your hardware server supports IPMI, the manufacturer has pre-installed an SNMP agent, or has an ILO board, you can include these as hosts in the monitoring as well.
Step 7: The Checkmk forecasting
You have now set up a monitoring of your file server, which includes the operating system, the function of your file server logs, a backup cronjob, and your RAID. With this, you have already created a good foundation. Nevertheless, you should not close your file server's host view in Checkmk just yet. As mentioned at the beginning, forecasting metrics can help you avoid nasty surprises. Checkmk can create such a prediction for you based on historical data. The special feature here is that Checkmk takes trends and temporary development into account in its forecasting.
The monitoring needs a certain data basis in order to create reliable forecasts. The minimum requirement is data from the last 48 hours, but data over several days is better. If you have just added your file server to the monitoring, you still lack the required data basis. Nevertheless, I would like to briefly introduce the forecasting function of Checkmk at this point. Since the disk space on a file server is important, I want to forecast when it will reach its limits and I will need to expand it.
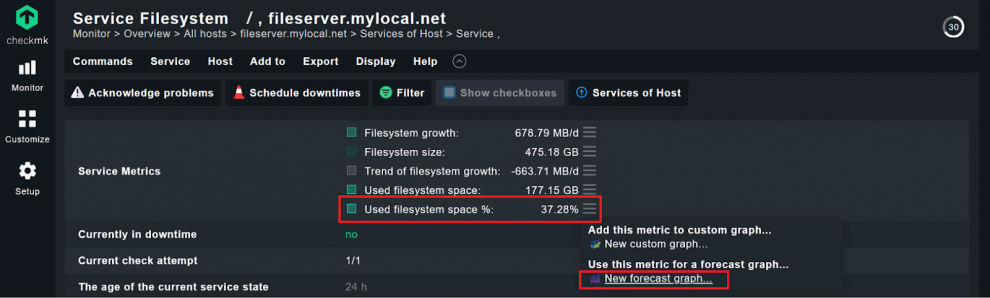
- In the host view, click on any service that produces metrics. I'll use the ‘Filesystem /’ service for my example.
- Scroll down to Service Metrics and select the metric you want to use for forecasting. I'll take ‘Used filesystem space %:’ to look at the trend in percentage memory usage. Click on the action menu and select ‘New forecast graph’.
Now you will see a prediction graph for the file system. The blue line shows the actual measured data. The red line corresponds to the forecast and the yellow area corresponds to the confidence level. As you can see, Checkmk does not make a simple linear approximation, but responds to past trends and takes them into account in the prediction. Checkmk is also not misled by one-off events. Despite a deletion event on February 13, Checkmk correctly assumes a continuous data growth.

Below the graph, you can control the calculation of the graph via the model parameters. Depending on how you configure them, the bases for the graph change. Especially important are the fields Consider history of and Forecast into the future. These decide on which data basis (if available) Checkmk creates the forecast and how far to extend it into the future. By default, Checkmk uses data from the last month and makes a forecast for the next four weeks. However, with enough historical data, Checkmk can easily give you forecasts for several months. For details on the other model parameters and the mathematical mechanisms, see the Checkmk manual’s chapter on forecasting.
Conclusion: File server monitoring with Checkmk is not rocket science
And that concludes this tutorial. Your file server will probably look a little different in practice, but Checkmk is ready for most scenarios. With the described combination of Checkmk agents and active checks, as well as the possibility of adding further data sources, by following the tutorial you will be able to easily monitor most file servers.
A possible next step would be to adjust the thresholds for notifications. While Checkmk provides default threshold values for many services, it may make sense to customize these depending on your individual server environment. For example, if you can only work on a server during maintenance windows, Checkmk should notify you earlier about problematic conditions. For detailed information on customization, see the chapter on host and service parameters in the Checkmk manual.
Should you have any problems, you can always contact the Checkmk Community on the Checkmk Forum.
Related Articles